Click for full size image.
Possible Signs of Energy Storage in the Corona
|
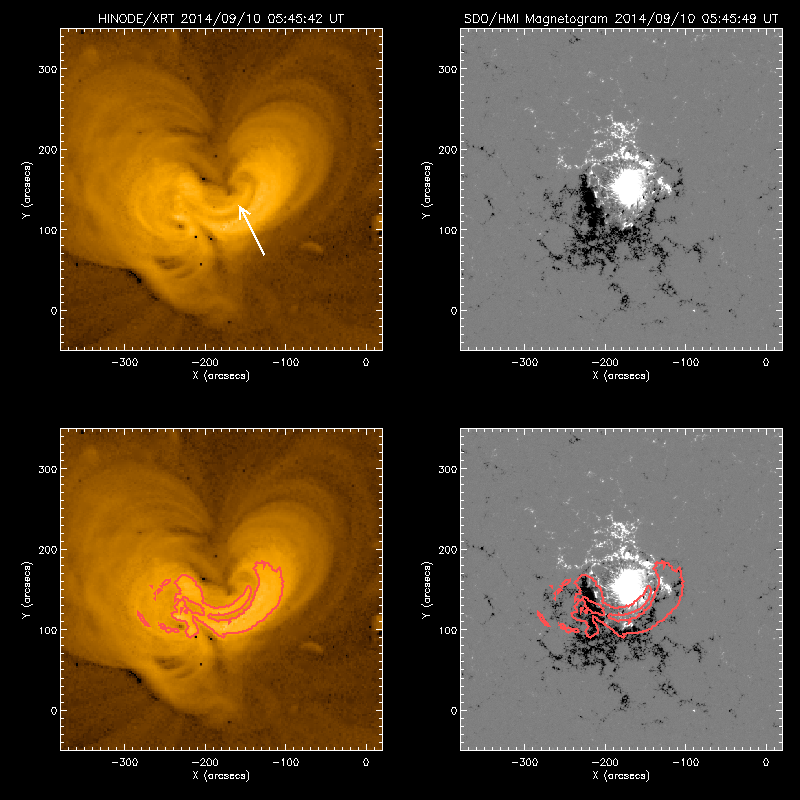
Two views of Active Region 12158 are shown above: an X-ray image taken by Hinode/XRT (left column) and a "magnetogram" from SDO/HMI (right column). In the lower panels, red contour lines from the brightest parts of the X-ray image are overlaid to show their spatial relationship. The magnetogram provides information on the magnetic field strength at the surface, or photosphere. Magnetic field lines come out of the white patches (positive polarity) into the atmosphere above (corona), and most of them loop back into the black patches (negative polarity). It's not easy to deduce the magnetic field structure in the corona from magnetograms alone, and X-ray images can provide additional information because X-ray loops are good tracers of the coronal magnetic field. In the figure above, an X-ray loop indicated by a white arrow lies parallel to a boundary between white and black patches, known as a "polarity-inversion line." Low-energy (potential) magnetic field lines cross these boundaries perpendicularly, directly from white to black. The presence of the parallel X-ray loop seen here possibly indicates a highly sheared, or bent, magnetic structure that is storing free magnetic energy that may eventually be released as a flare. And, about 12 hours after this observation, this active region released its free magnetic energy as an X-class flare. Keywords: Magnetogram Filters: Al_mesh, SDO/HMI |
(Prepared by Keiji Yoshimura)
| Back | Archive | Next |