Three Years in the Life of XRT
|
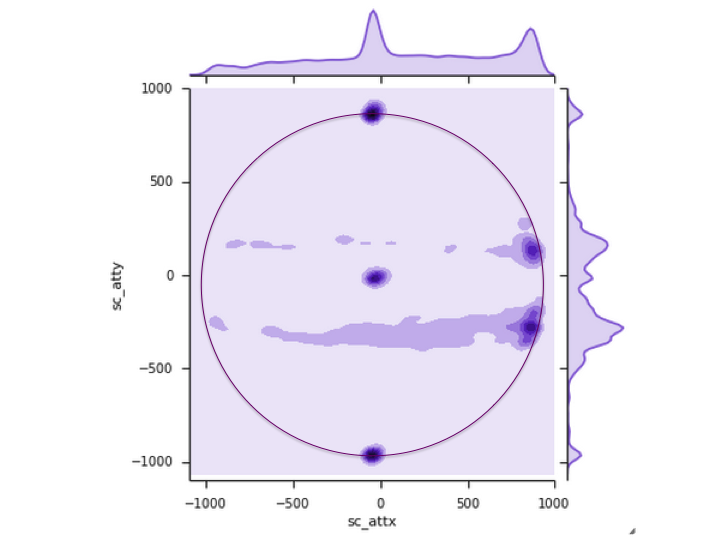
The sun is huge compared to the field of view of most of the Hinode instruments so several times a week, a meeting is held to determine where to point the satellite. Hinode scientists choose where to point the satellite based on solar conditions and the needs of the scientific community. So, where are the most interesting places on the sun? This plot shows the frequency that Hinode has pointed at a given location on the sun over the past 3 years. Darker shades of purple mean the more times Hinode has looked there. The histogram on the top and right of the chart show how many images were taken at a given x-coordinate and y-coordinate respectively. This paints an interesting picture about what types of things Hinode and XRT like to study. The first thing you might notice are three purple dots on the north pole, sun center, and the south pole. XRT monitors the poles frequently as part of a campaign to understand the magnetic field and coronal structures around the poles. Pointings at the center of the sun happen at least twice a day to take full disk synoptics to track the overall appearance of the sun. Both on top and below the equator of the sun, two bands are evident. This is because active regions are more common near, but not at, the equator. Where the active regions lie depends on the 11-year solar cycle. At the beginning of a cycle, active regions appear relatively high up and then slowly move closer to the equator as the sun approaches solar minimum. This is called the butterfly diagram. You can also see that the bands become thicker on the right side of the sun. The sun in constantly rotating, but we can't see active regions until they are on the side of the sun facing us. When an active region rotates on to the disk on the left, it takes the telescope planners up to a few days to react, make a plan, and tell the telescope to turn to that region. By that time, it has rotated away from the limb. But seeing an active region on the limb has great advantages for learning about the structure of the region. Since we know when an active region will be rotating away from us behind the right limb, it is a very popular place to look, hence the two dark spots on the right of the plot. Keywords: Hinode Pointing Filters: |
(Prepared by Nicole Schanche)
| Back | Archive | Next |