Harvard-Smithsonian Center for Astrophysics
XRT E2E Test
Day 20050610 Shift B
Test Conductor E. DeLuca
Shift Scientists M. Weber & J. Scott
Telescope Sensitivity (Cu-L; CCD Temp = -99.3 C)
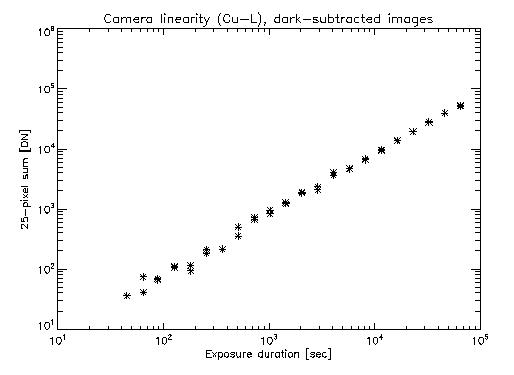
We investigated the linear response of the CCD today. We took a series of images at a range of exposure durations from a few millsec to 65.5 sec. For analysis, we took two pairs of normal and dark images at each exposure index, and subtracted the dark from the corresponding normal image. We then summed the 5x5 pixels centered on the source spot image. The summed signal is plotted versus exposure duration in the first plot. (There are two data points at most exposure positions because we took two pairs of normal/dark.)
It is apparent that the CCD response is linear over several decades. The variation at the shortest exposures probably occurs because the signal does not dominate the noise at these durations.
Next we looked at the dark images. Again, we summed the signal over the 5x5 pixels centered on the location of the spot in the normal images. This plot indicates that the dark signal is flat over all exposure indices. This suggests that the dark signal is dominated by the readout noise. Note that the CCD temperature was -100 C, so it is to be expected that the thermal noise was insignificant.

Verifying Best Focus Position
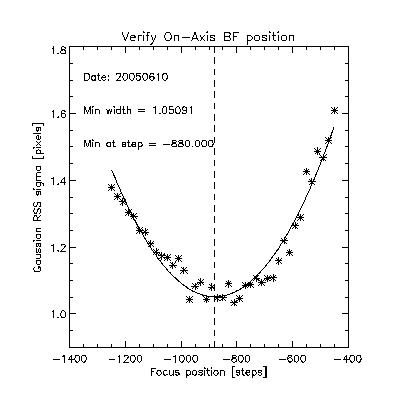
There was a concern that the telescope tube has changed size because of outgassing over the past few days, thus affecting the focal length. We re-ran the Best Focus sub-test. For a set of 41 focus positions running from -1250 to -450 steps, in jumps of 20 focus-steps (~10 um), we took images and fit the spots with 2D Gaussians. The RSS Gaussian sigmas are plotted below as a function of focus position.
The data were fitted with a 2nd degree polynomial to locate the minimum width at Best Focus. The result is BF = -880 steps = -531 um. The position we found on 20050607 was BF = -850 steps = -515 um. Therefore, the focal length has only changed by approximately 15 um. The variance of our measurements in the vicinity of Best Focus typically implied that our uncertainty in determining the Best Focus position is on the order of 40 um. Therefore, we conclude that the focal length has not appreciably changed. (The data points in the plot below do not look inconsistent with a value of BF = -850 steps.)
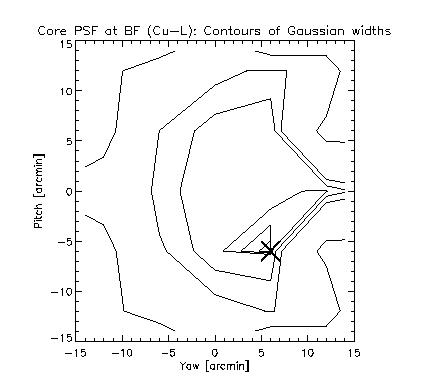
Core PSF at BF (-770 steps), Cu-L source
We performed a 2D scan in pitch/yaw at the positions illustrated in the first plot.
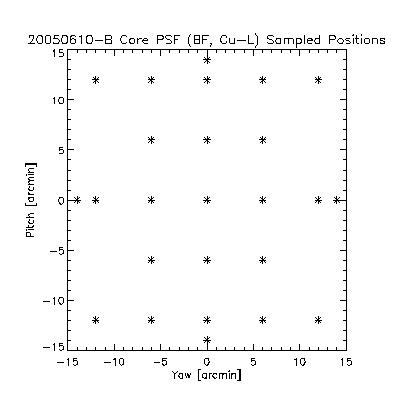
The spot images were fitted with 2D Gaussians, and the RSS sigma as a function of scan position is plotted below as a contour surface. The minimum width was 1.05 pixels, located at the p/y = (-6,+6) position, marked in the plot with an "X".
Note the locations of the sampling gaps indicated in the first plot above. The minimum width is located adjacent to one of these gaps, which creates an exaggerated gradient in the contour plot. Likewise, the "pinched" contours at positive Yaw are artifacts of the preparation, and do not represent real measured valules.
FOV Optimized Focus
We performed 1D scans in pitch/yaw at three focus positions in order to characterize the instrument Field Of View for the current boresight setting. For the "ORIG" (p/y = 0,-1.17') boresight position, the BF position had previously been determined to be at BF = -472 um = -770 steps. As is shown in the previous OF 1D scans, the critical width threshold (2.02 pixels) is marked with a horizontal dashed line. OF is determined at the focus position where the central maximum of these plots crosses the critical threshold.The first focus-position was at BF+100um = -372 um = -595 steps. The 1D scan sampled the following 19 distances (in arcmin) from center: {-16, -15, -14, -12, -10, -8, -6, -4, -2, 0, 2, 4, 6, 8, 10, 12, 14, 15, 16}. This corresponds to the following pitch/yaw coordinates relative to the boresight: (11.31,-11.31) (10.61,-10.61) (9.90,-9.90) (8.49,-8.49) (7.07,-7.07) (5.66,-5.66) (4.24,-4.24) (2.83,-2.83) (1.41,-1.41) (0.00,0.00) (-1.41,1.41) (-2.83,2.83) (-4.24,4.24) (-5.66,5.66) (-7.07,7.07) (-8.49,8.49) (-9.90,9.90) (-10.61,10.61) (-11.31,11.31).

The second focus-position was at BF+200um = -272 um = -426 steps. The 1D scan sampled the following 13 distances (in arcmin) from center: {-12, -10, -8, -6, -4, -2, 0, 2, 4, 6, 8, 10, 12}. This corresponds to the following pitch/yaw coordinates relative to the boresight: (8.49,-8.49) (7.07,-7.07) (5.66,-5.66) (4.24,-4.24) (2.83,-2.83) (1.41,-1.41) (0.00,0.00) (-1.41,1.41) (-2.83,2.83) (-4.24,4.24) (-5.66,5.66) (-7.07,7.07) (-8.49,8.49).

The third focus-position was at BF+300um = -172 um = -262 steps. The 1D scan sampled the following 13 distances (in arcmin) from center: {-12, -10, -8, -6, -4, -2, 0, 2, 4, 6, 8, 10, 12}. This corresponds to the following pitch/yaw coordinates relative to the boresight: (8.49,-8.49) (7.07,-7.07) (5.66,-5.66) (4.24,-4.24) (2.83,-2.83) (1.41,-1.41) (0.00,0.00) (-1.41,1.41) (-2.83,2.83) (-4.24,4.24) (-5.66,5.66) (-7.07,7.07) (-8.49,8.49).
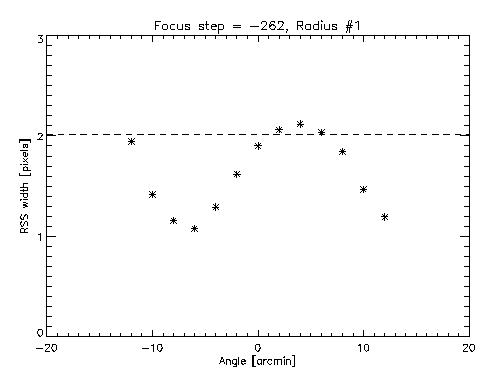
Because the central maximum has exceeded the critical width in the third plot, we are confident that our data spans the OF position. and that this dataset can be used to characterize the optimized FOV.