Click on a sun for a short video. Also available on YouTube.
Solar Cycle 24
|
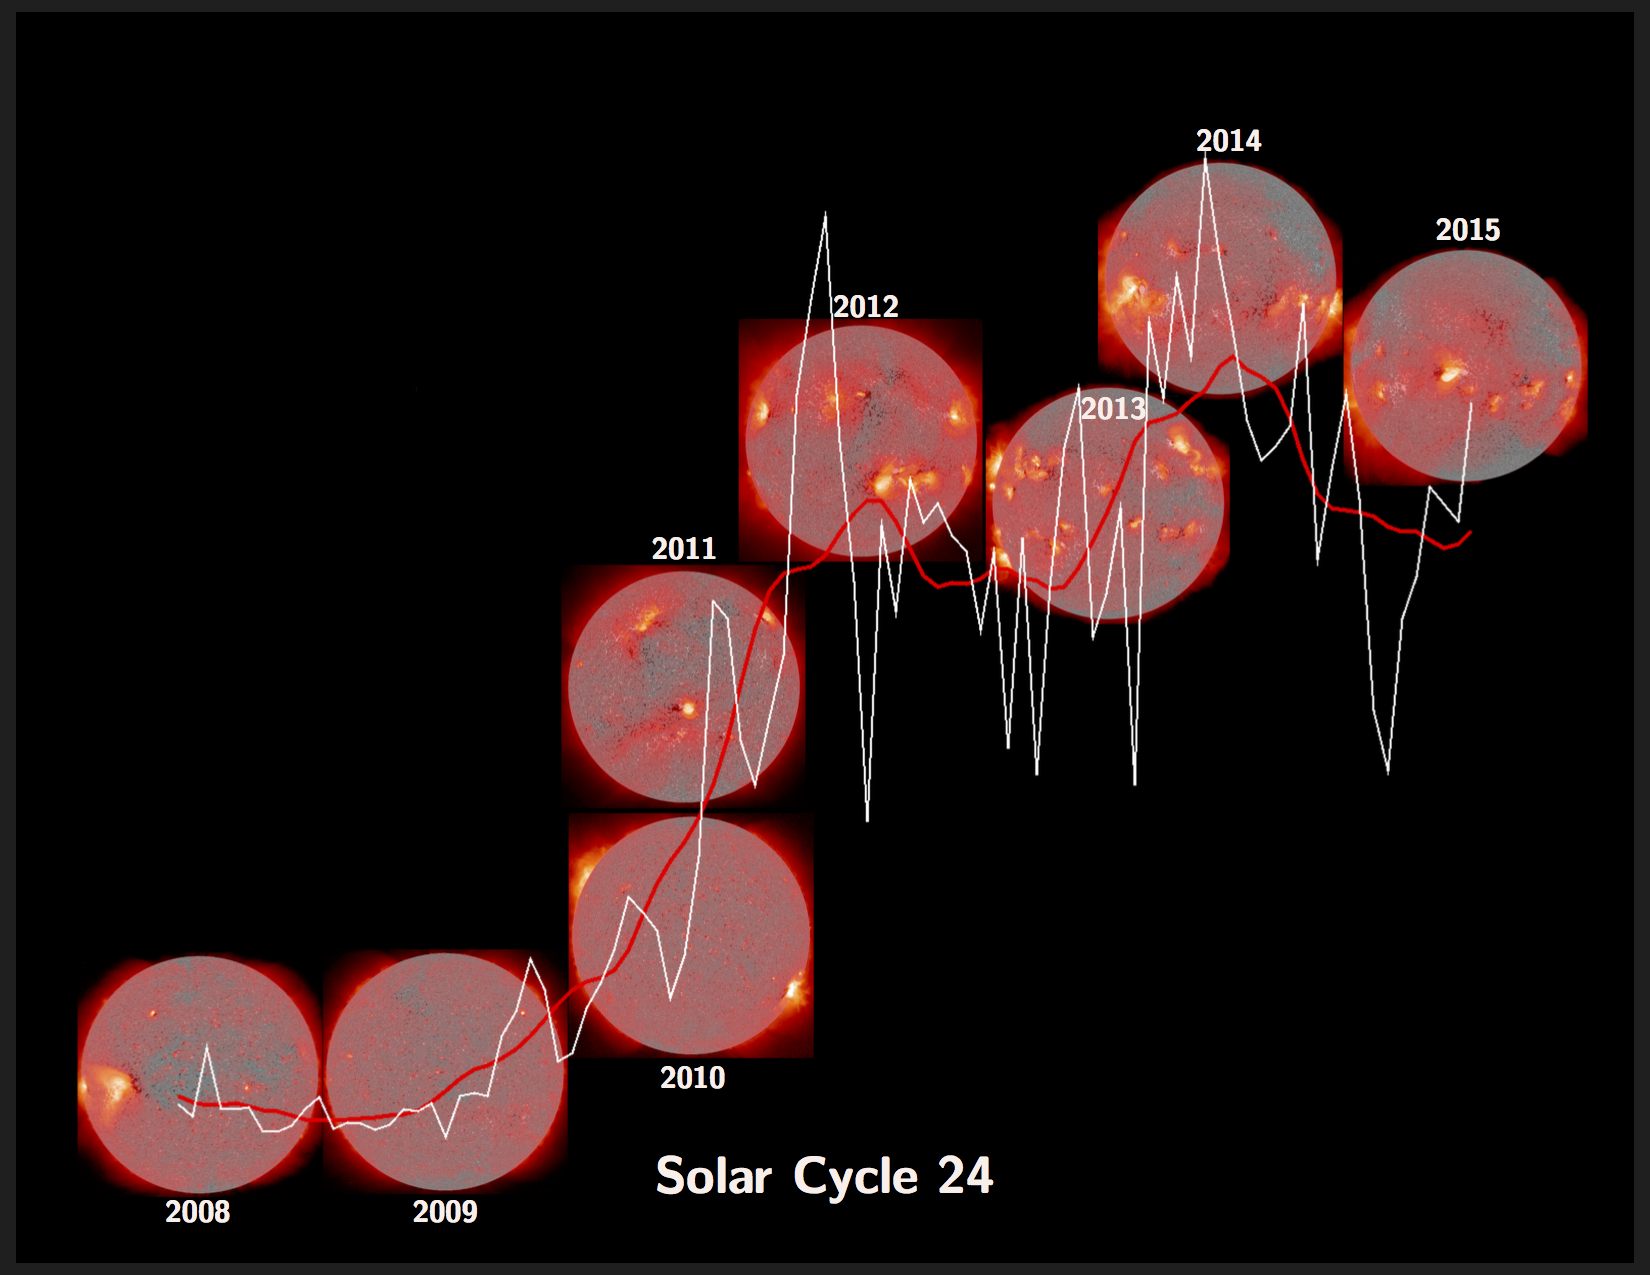
The current solar cycle began on 4 January 2008 with the emergence of a small bipolar active region in the northern hemisphere. Here are composite Hinode XRT x-ray images with either SOHO MDI (2008-2010) or SDO HMI (2011-2015) taken on 4 January every year of the current solar cycle. The graph shows a plot of the number of sunspots (ranging from 0-110) of the smoothed solar cycle, (red) and observed solar cycle (white). It was created with data from the IPS Radio and Space Services website. The solar image coincides with the timeframe on the plot.
The cycle is beginning to decline, and it is during this phase when the sun typically generates large scale
flares and CMEs while it sheds the last of the cycle's magnetic flux.
|
(Prepared by Patricia Jibben)
| Back | Archive | Next |