Click for full resolution image.
Solar Activity Belts
|
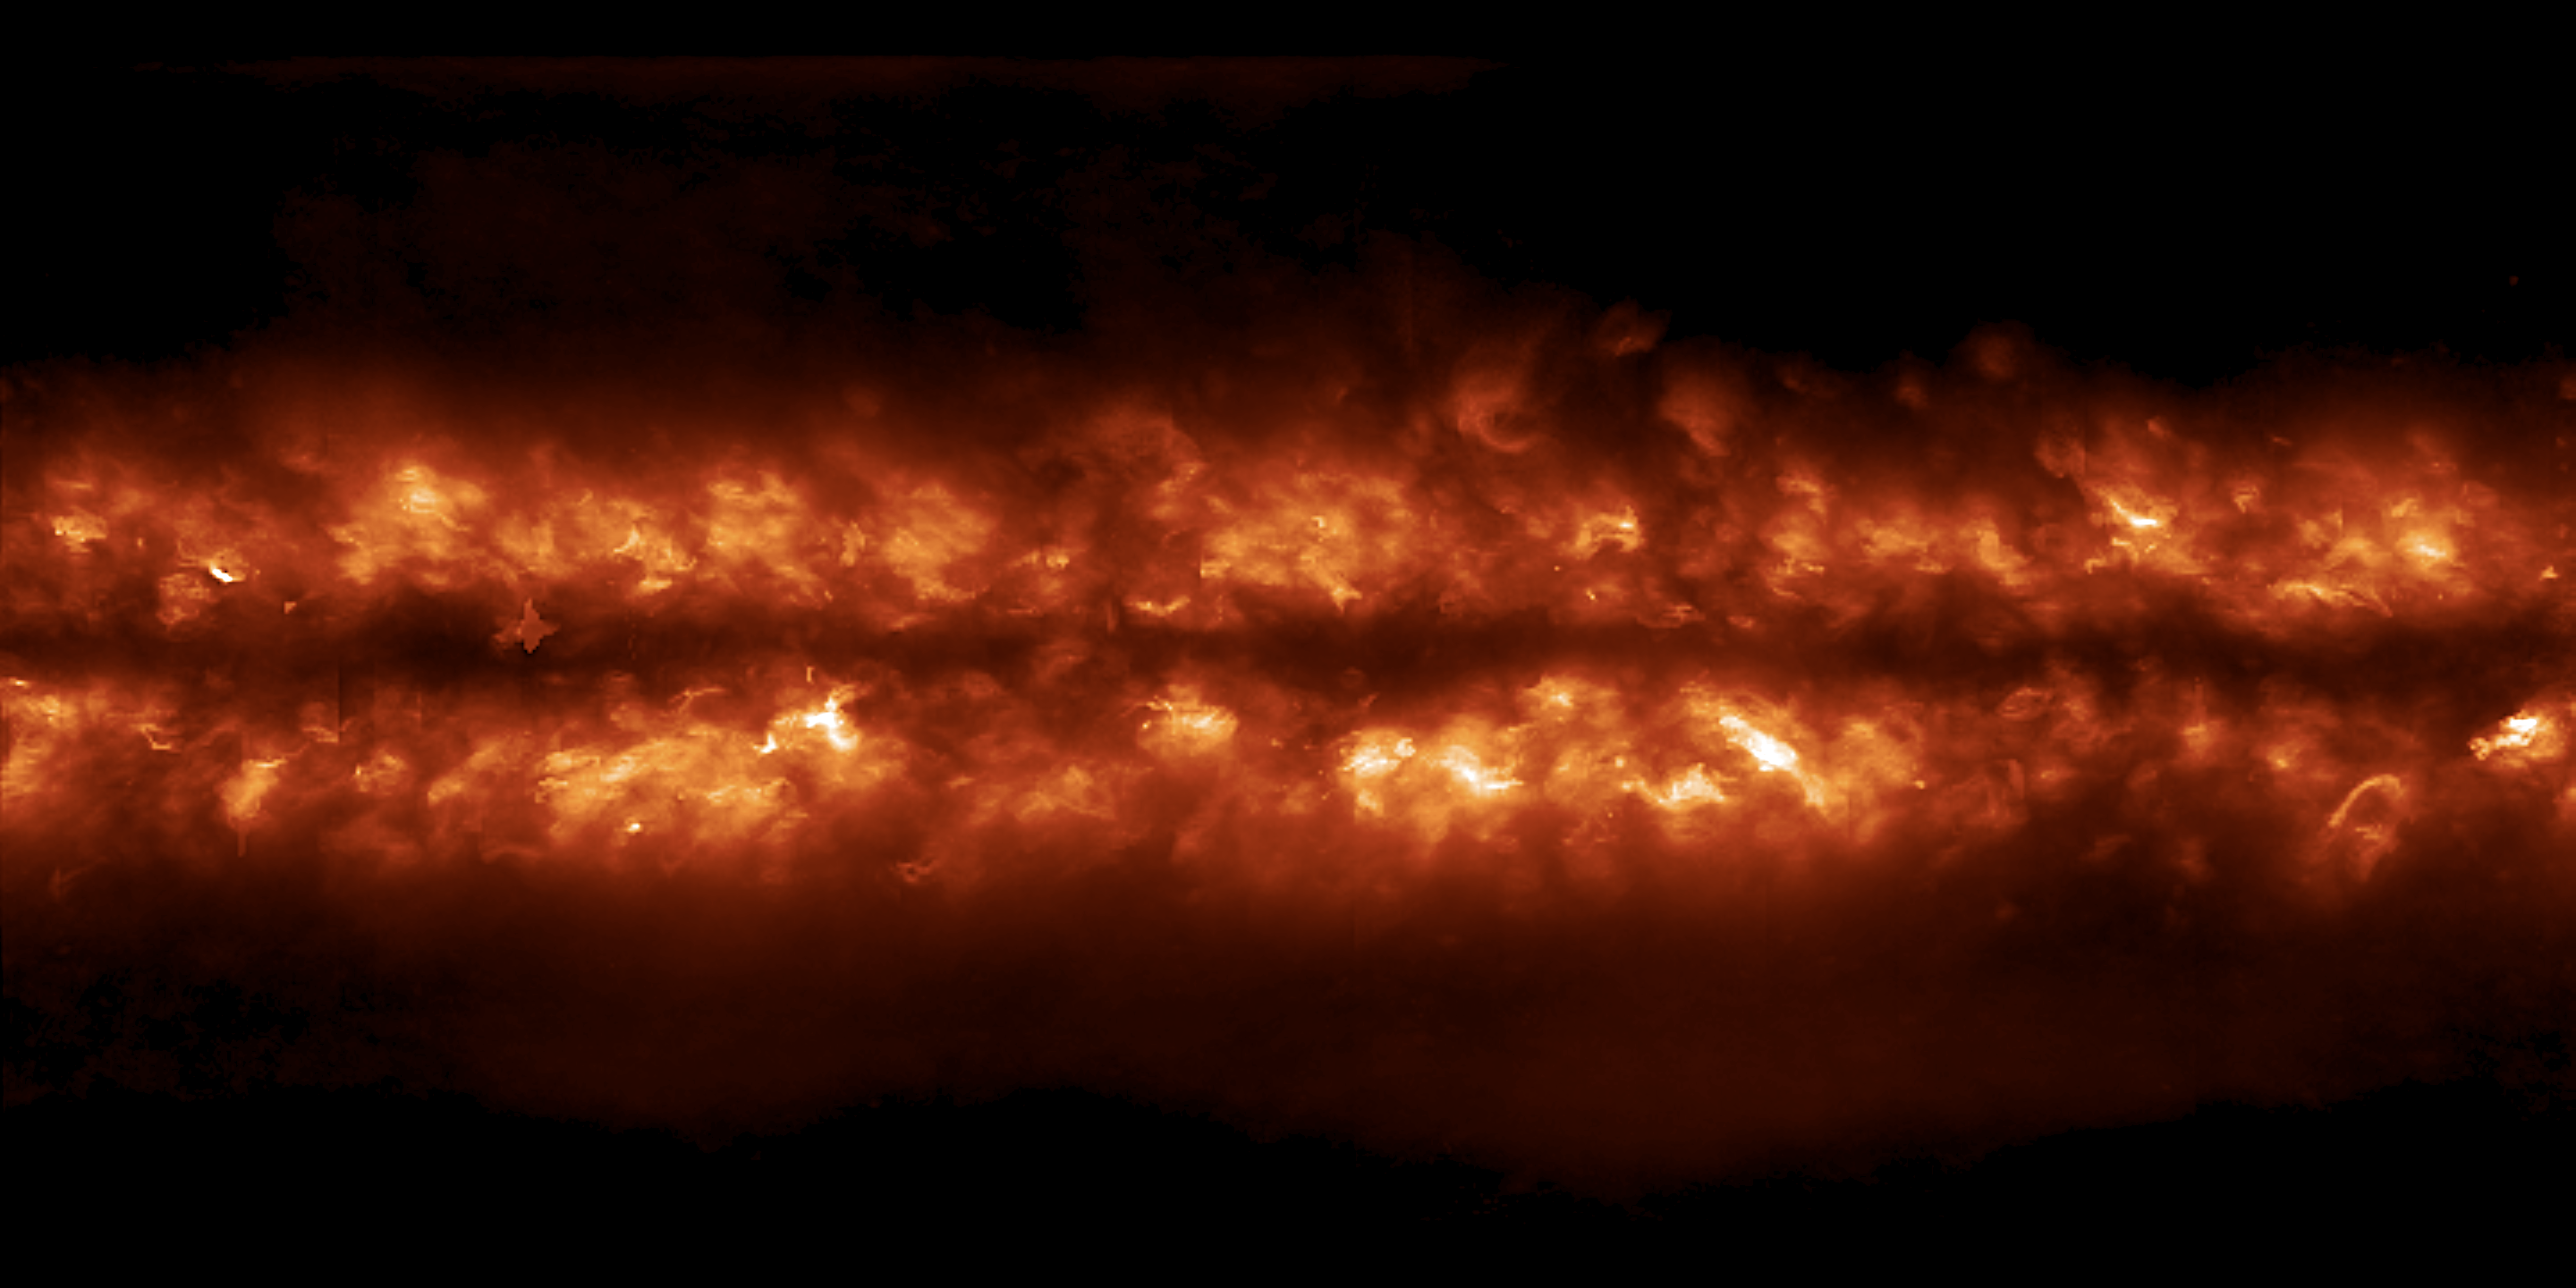
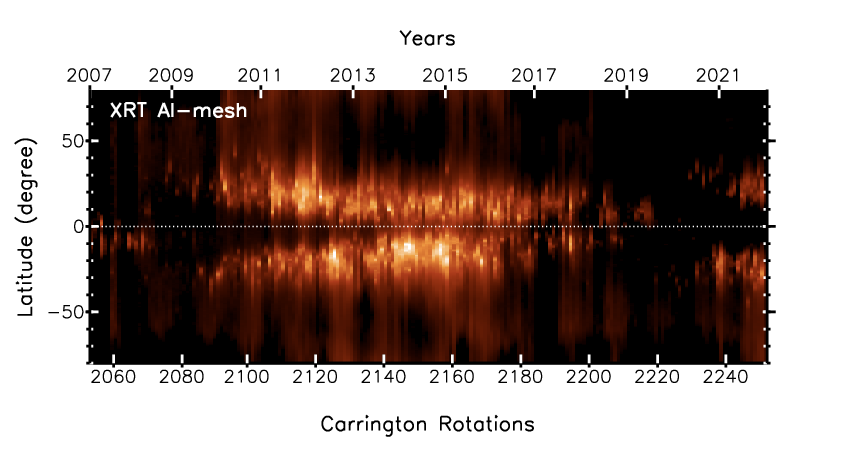
Solar Cycle 24 is wrapping up and with 13 years and over 11 million X-ray images, the X-ray Telescope shows how the X-ray output of the Sun varied over the cycle. The X-ray butterfly diagram shows the slow progression of active regions towards the equator and it shows how the X-ray canopy extends to higher latitudes with larger active regions. Solar cycle butterfly diagrams can be made from XRT Carrington Maps. These maps include data over several weeks and thus show how the Sun's active regions change over a longer time period. When we look at solar magnetism on longer time scales we notice that there are particular longitudes where active regions emerge over several rotations. So does this mean that there are particular locations on the Sun that are more active than others? One way to check is to take an average of all the Carrington maps. The above image shows the average of all cycle 24 Carrington maps. Active regions may tend to emerge at the same longitude over several solar rotations but over cycle timescales, this image suggests emergence is random. But this image doesn't tell the whole story. A wavelet analysis of the image shows a faint band of X-rays between the activity belts and both polar crowns. This faint band is barely above the background but it is a stable large-scale structure and it is more prominent in the south which is consistant with other observations that show the southern hemisphere was more active during this cycle. Could these be part of the extended solar cycle? Could it be there because that is where the neutral line between old and new cycles sit or is it simply because the polar coronal holes are impenetrable due to their open magnetic fields and things get heated as they pile at the border?
The XRT Carrington maps could help answer these questions.
|
(Prepared by Patricia Jibben)
The XRT instrument team is comprised of SAO, NASA, JAXA, and NAOJ.
| Back | Archive | Next |