Mouse over for composite animation.
Click image for full size and click here for movie.
Also available on YouTube.
X-Ray Sun Two-Month Mashup
|
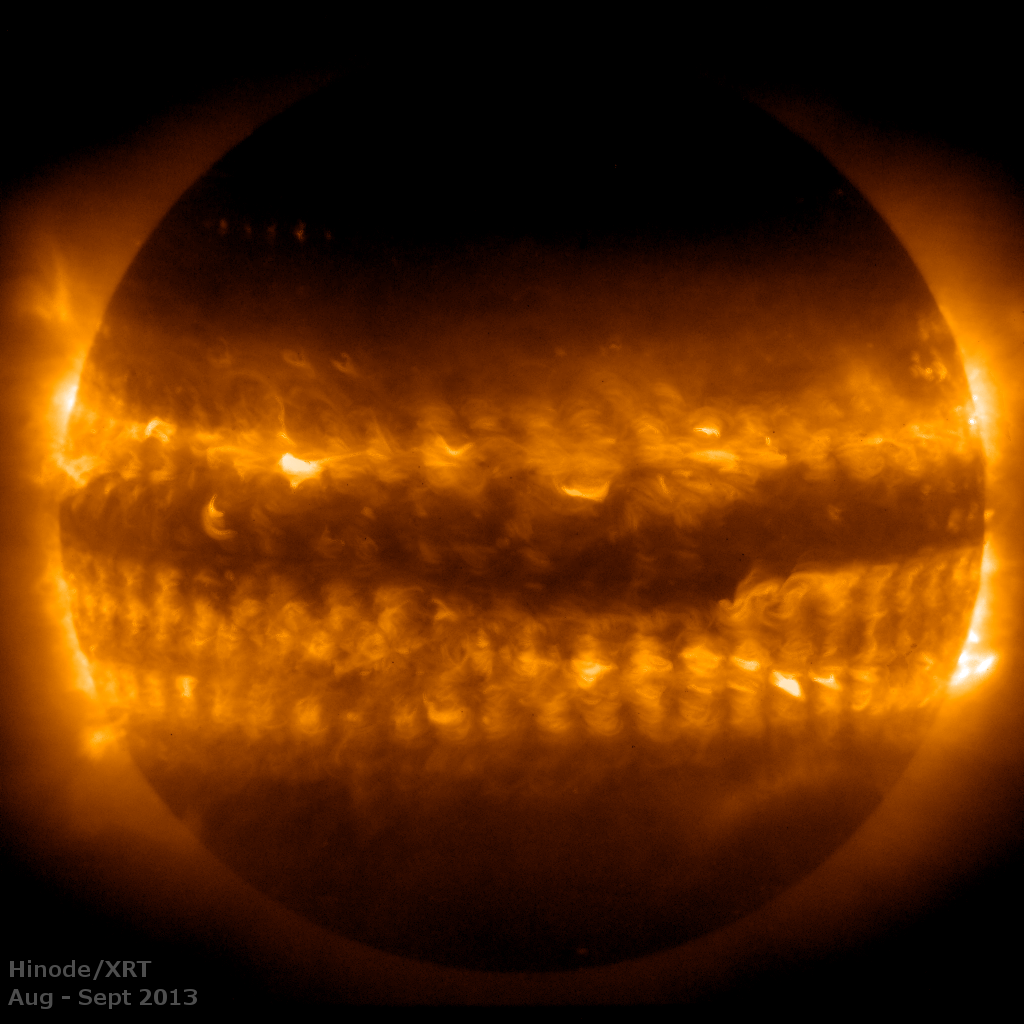
This image was created by adding together 54 observations of the Sun's 10-million degree outer atmosphere, called the corona. The observations were made between August 17th and October 4th, and you can see it all coming together by hovering your mouse over the image. Perhaps the most striking feature of this visualization is how the activity is concentrated in horizontal bands above and below the equator. These so-called "activity belts" start closer to the poles and gradually move to low latitudes as the 11-year solar cycle progresses. We're currently in the maximum phase of this cycle, when there are many active regions clustered around 15 degrees above and below the equator. In the coming years, activity will concentrate even closer to the equator, as it peters out and the cycle begins anew. The driver of the activity belts is the solar dynamo, which generates the Sun's magnetic field and ultimately produces all of the fun events documented on this site. However, the dynamo is a mysterious beast. The basics of it are very much the same as the electromagnetic you probably made in science class, where a magnetic field is created by sending an electric current through a coiled wire (Ampère's law). For the Sun, the electric current is the plasma swirling around its interior. But beyond that, the details get murky and scientists are working hard on sorting them out. Keywords: Full Disk, Solar Cycle Filters: Be_thin |
(Prepared by Patrick McCauley)
| Back | Archive | Next |