Click full size or here for separate images.
Full-Sun Images in Three Temperature Ranges
|
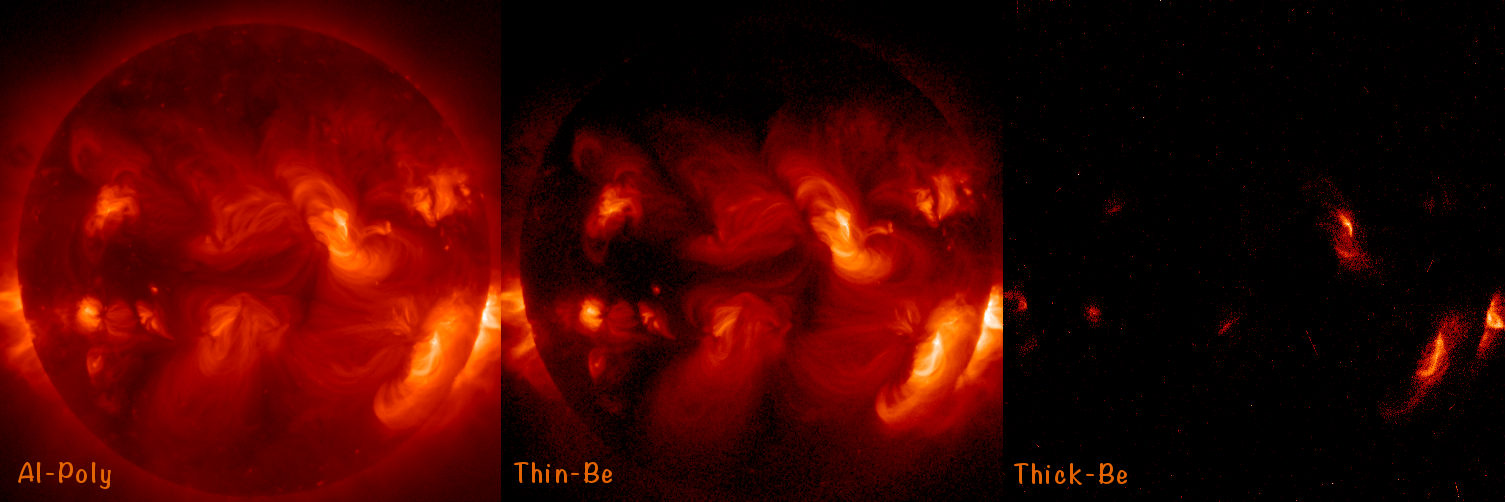
To study the long-term evolution of the sun's atmosphere, XRT runs a synoptic program that takes full sun X-ray images twice per day. On November 20, 2013, XRT ran this program using all of its 9 X-ray filters and three of those images are presented here. The sun's outer atmosphere (a.k.a. corona) is extremely hot, with the low temperatures just under a million degrees and the hot areas just above 10 million degrees. The X-ray filters on XRT are perfect for determining temperatures of the corona. The left image (Al-Poly) shows the sun's entire outer atmosphere, both the cool areas and the really hot areas. The dark areas are cool and the bright areas are hot. This is the most complete picture of the corona, but because it shows all temperatures, it is hard to determine where the cool or hot regions are. The middle image (Thin-Be) is just thick enough to prevent the low temperature regions from showing. As you can see most of the sun is dark in this image because most of the sun is actually pretty cool, only around a million degrees! The bright areas in this image correspond to temperatures around 10 million degrees. Notice these areas look like little islands surrounding a sea of darkness. These islands are actually called active regions and typically have sunspots under them. But how hot does the sun get? To answer this we look at the right image (Thick-Be) where most of the cool and warm areas won't show. This filter is so thick that it barely detects areas that are 10 million degrees. The exposure of this image was 65 times that of the Al-poly image and we can't even tell it's a picture of the sun. The brightest areas in this image are above 10 million degrees but that is all we can determine. Click here for a summary of XRT's temperature responses. Keywords: Full Disk, Temperature Structure Filters: Al_poly, Be_thin, Be_thick |
(Prepared by Patricia Jibben)
| Back | Archive | Next |