Click for movie. Also available on YouTube.
XRT joins GitHub!
|
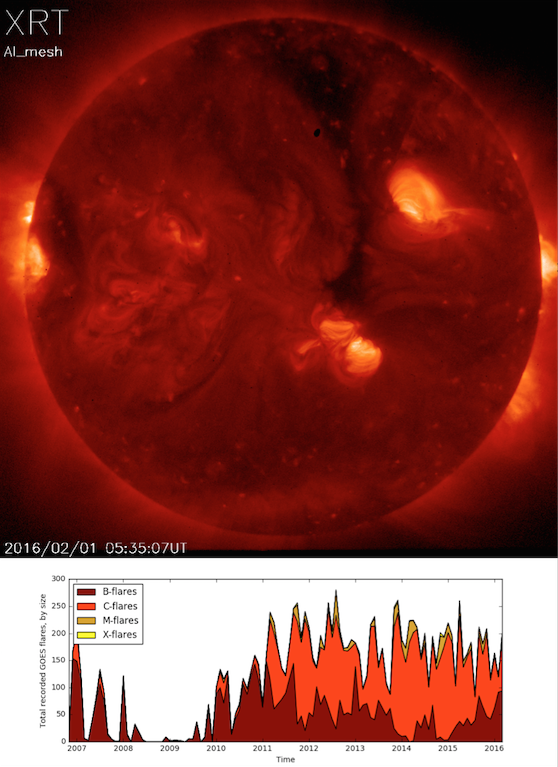
XRT is now the proud owner of a new GitHub page! This is a great way to share not only the images and movies, but also the code used to make them. You can 'clone' the repository so you can access the the code and generate the image files yourself (or make changes to customize the plots to you). If you are new to github, check out this tutorial first. This movie shows XRT synoptic images since launch in 2006. The sun reached the peak of solar cycle 24 in ~2014 and is now declining in activity. The plot shows the total number of flares recorded by the GOES spacecraft over time, broken down by size. In the movie, the legend also includes a flare count for the month covered with the blue bar.
It may seem like the smaller B-flares stop occurring during the peak of the cycle. On the contrary, they are more common, but all of the increased activity washes them out so they can't be detected above the noise.
|
(Prepared by Nicole Schanche)
| Back | Archive | Next |