Harvard-Smithsonian Center for Astrophysics
XRT Testing Day 20050611 Shift B
Day 20050611 Shift B
Test Conductor E. DeLuca
Shift Scientists M. Weber & J. Scott
Telescope Sensitivity (Al-K; CCD Temp = -60 C)
We investigated the linear response of the CCD today. We took a series of images at a range of exposure durations from a few millsec to 65.5 sec. For analysis, we took a pair of normal and dark images at each exposure index, and subtracted the dark from the normal image. We then summed the 5x5 pixels centered on the source spot image. The summed signal is plotted versus exposure duration in the first plot.It is apparent that the CCD response is linear over several decades. The variation at the shortest exposures probably occurs because the signal does not dominate the noise at these durations.
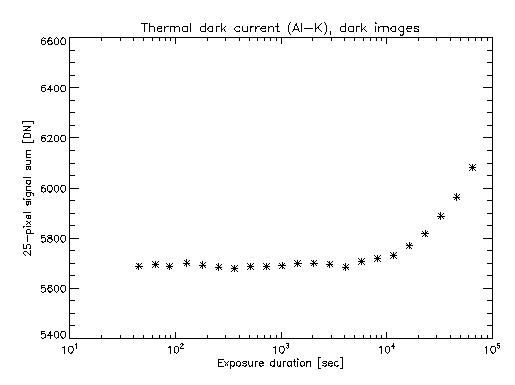
Next we looked at the dark images. Again, we summed the signal over the 5x5 pixels centered on the location of the spot in the normal images. This plot indicates that the dark signal is flat over most exposure indices. This suggests that the dark signal is dominated by the readout noise in this range. We see an upturn at the longest exposures, which is probably due to the thermal dark current.
The upturn is consistent with the linearity tests we ran with the Cu-L source because this data was taken with CCD temperature = -60 C. If you refer to the sensitivity analysis for 20050610 Shift-B, the plot for that day shows a flat dark current versus exposure duration, because that data was taken with CCD temperature = -100 C. I have verified the index=35 data points for the Cu-L and Al-K plots "by hand" (ie, without relying on our automated processing) , and the plotted signal sums for those points are true.
In the following plot, we show the slope of the dark current signal versus exposure index.
This next plot zooms in on the slope of the dark current for the long exposures. It is clear that the slope is a constant, which indicates that the thermal noise over long exposures is (approximately) a linear function of exposure duration.
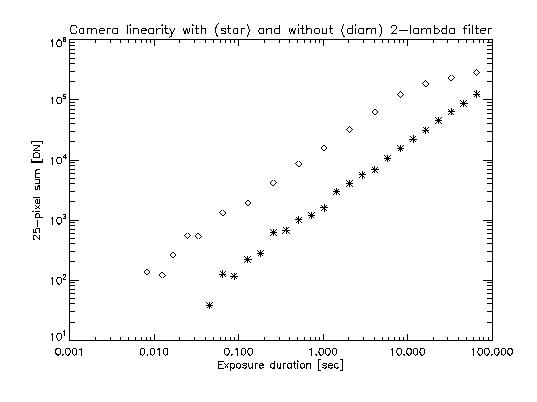
For the second section of the Sensitivity Test, we removed the 2-lambda filter on the source. The effect is that a larger spectral band is allowed to shine on the XRT, and consequently we see more photons. We took normal/dark pairs of images over a range of exposure durations. In the next plot, the data taken without the 2-lambda filter is represented with diamonds. Asterisks indicate the data taken with the filter, which is the same as shown in the first plot.
The turnover at long exposures is due to saturation in the unfiltered images. The data at the shortest exposures indicate that the CCD has a linear response over that part of the range, as well.
FOV Optimized Focus Position
We went back and performed the 1D scans orthogonal in pitch/yaw to the ones we took yesterday (20050610, Shift-B).
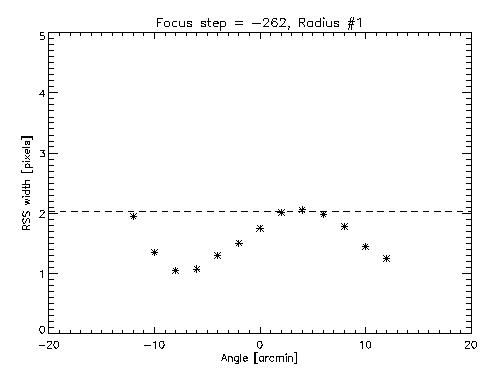
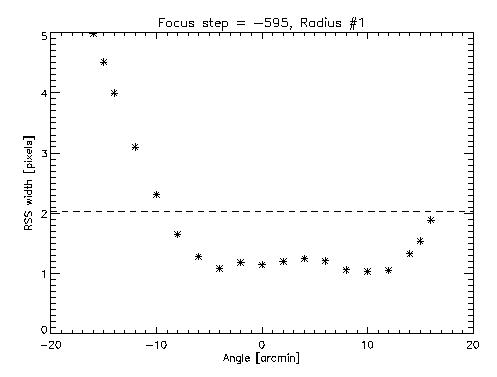
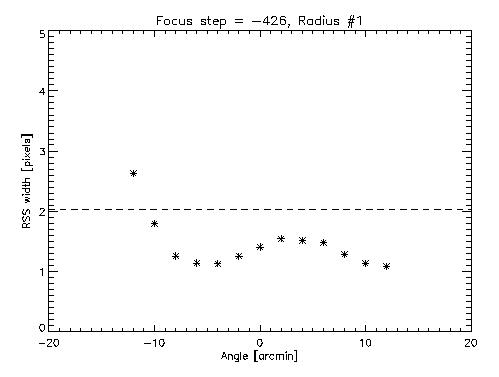
We performed 1D scans in pitch/yaw at three focus positions in order to characterize the optimized FOV for the "ORIG" (p/y = 0,-1.17') boresight setting. For the current boresight position, the BF position had previously been determined to be at BF = -472 um = -770 steps. As is shown in the previous OF 1D scans, the critical width threshold (2.02 pixels) is marked with a horizontal dashed line. OF is determined at the focus position where the central maximum of these plots crosses the critical threshold.
The first focus-position was at BF+100um = -372 um = -595 steps. The 1D scan sampled the following 19 distances (in arcmin) from center: {16, 15, 14, 12, 10, 8, 6, 4, 2, 0, -2, -4, -6, -8, -10, -12, -14, -15, -16}. This corresponds to the following pitch/yaw coordinates relative to the boresight: (11.31,11.31) (10.61,10.61) (9.90,9.90) (8.49,8.49) (7.07,7.07) (5.66,5.66) (4.24,4.24) (2.83,2.83) (1.41,1.41) (0.00,0.00) (-1.41,-1.41) (-2.83,-2.83) (-4.24,-4.24) (-5.66,-5.66) (-7.07,-7.07) (-8.49,-8.49) (-9.90,-9.90) (-10.61,-10.61) (-11.31,-11.31).
The second focus-position was at BF+200um = -272 um = -426 steps. The 1D scan sampled the following 13 distances (in arcmin) from center: {12, 10, 8, 6, 4, 2, 0, -2, -4, -6, -8, -10, -12}. This corresponds to the following pitch/yaw coordinates relative to the boresight: (8.49,8.49) (7.07,7.07) (5.66,5.66) (4.24,4.24) (2.83,2.83) (1.41,1.41) (0.00,0.00) (-1.41,-1.41) (-2.83,-2.83) (-4.24,-4.24) (-5.66,-5.66) (-7.07,-7.07) (-8.49,-8.49).
The third focus-position was at BF+300um = -172 um = -262 steps. The 1D scan sampled the following 13 distances (in arcmin) from center: {12, 10, 8, 6, 4, 2, 0, -2, -4, -6, -8, -10, -12}. This corresponds to the following pitch/yaw coordinates relative to the boresight: (8.49,8.49) (7.07,7.07) (5.66,5.66) (4.24,4.24) (2.83,2.83) (1.41,1.41) (0.00,0.00) (-1.41,-1.41) (-2.83,-2.83) (-4.24,-4.24) (-5.66,-5.66) (-7.07,-7.07) (-8.49,-8.49).