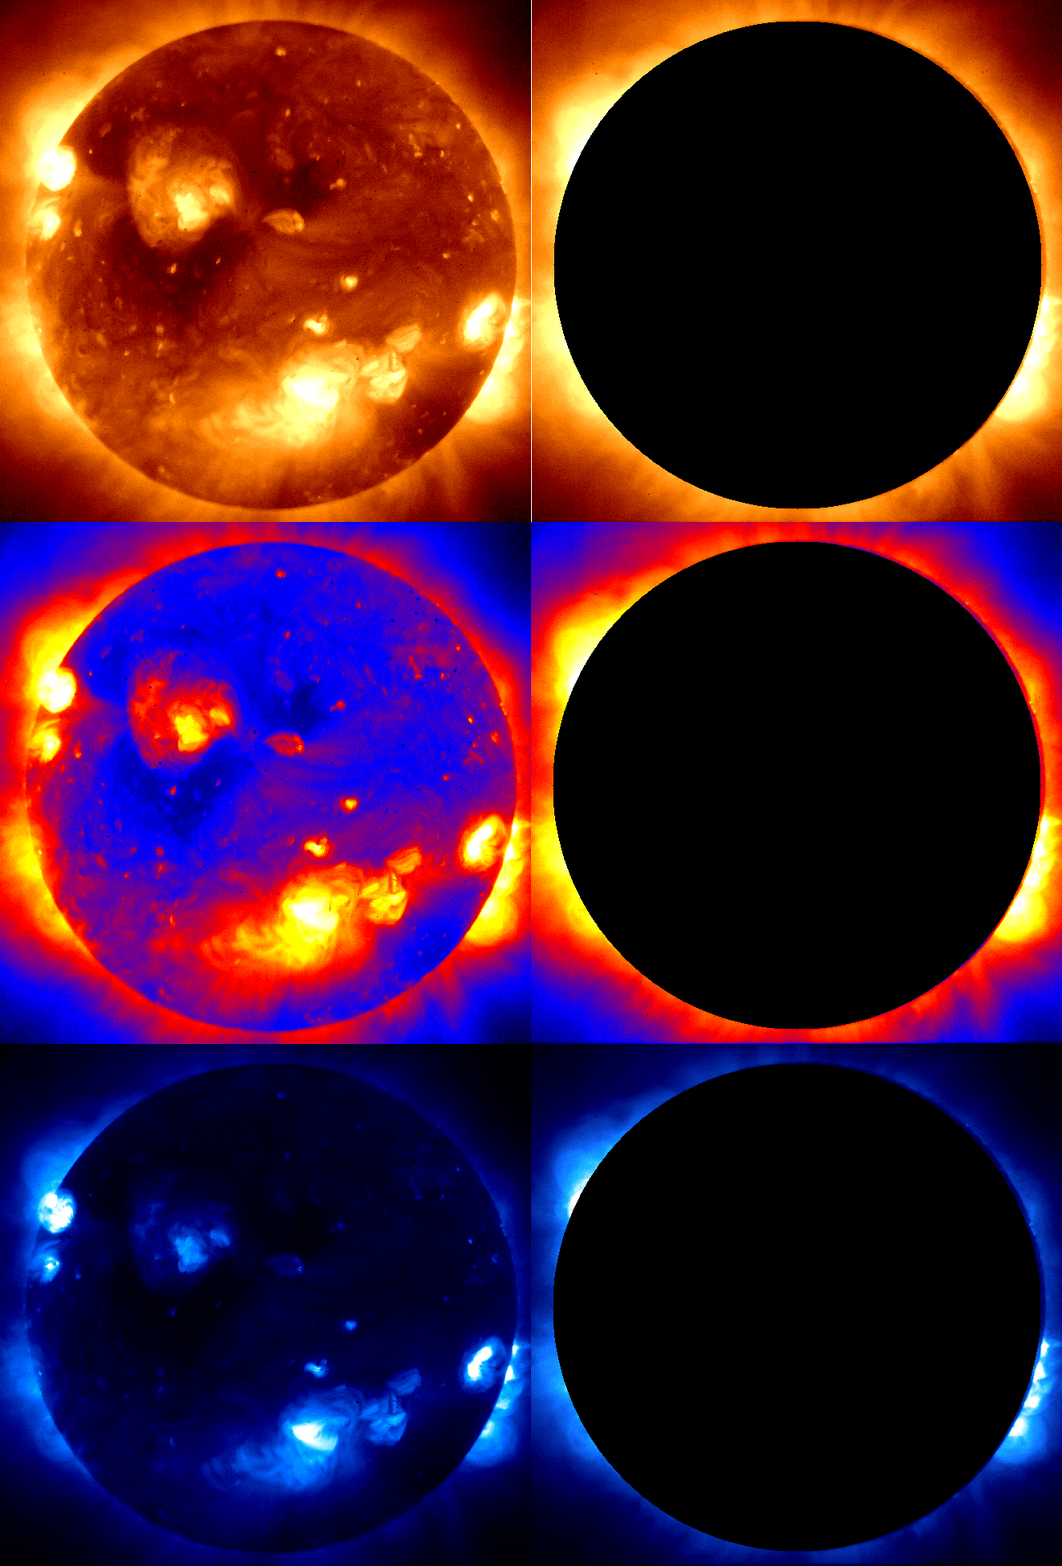
Summed and processed image of the 2022/10/25 eclipse observed by XRT. An average of the Sun during the eclipse was created and then a false eclipse was applied.
Reimagining the October 2022 Eclipse
|
As documented a few weeks ago, XRT recently saw a full annular eclipse when the Moon passed between XRT and the Sun. This dataset was processed to really draw out the features of the solar limb and corona. The result can be seen above in multiple different colors. An overall summed image from the dataset was generated and then a 'false eclipse' was applied to simulate what the data would look like with the Sun fully blocked by the Moon. The methodology of generating this image was fairly straightforward. First, all of the images of the eclipse were gathered. For each image, a map was generated where pixels blocked by the eclipse were set to 0 and pixels outside the range of the Moon were set to 1. Each image was then multiplied by the corresponding map and summed to only average over pixels not impacted by the eclipse for each image.The image was then divided by a total of all the maps. Meaning that pixels in the top right and bottom left of these images, which are not impacted by the Moon, were averaged the full 29 times since they appear unobstructed in every image. While pixels towards the center of the disk that were freqeuntly blocked are only averaged in the approximately 10 images that they were not blocked by the Moon's disk. Finally, a circular mask was applied at disk center to simualte the Moon fully eclipsing the Sun. Click here to see the interesting pattern that emerged from the mask used to make this model in a few different colors! Darker colors represent regions that were frequently shadowed by the Moon. Lighter colors mean that pixel was unobstructed in more images. Keywords: Eclipse, Full Disk Filters: Al_Poly |
(Prepared by Lucas Guliano)
The XRT instrument team is comprised of SAO, NASA, JAXA, and NAOJ.
| Back | Archive | Next |